
pyNamo-EGT
SCIENTIFIC SOFTWARE · PYTHON · EVOLUTIONARY GAME THEORY
Making strategic dynamics visible
pyNamo-EGT is a Python package I developed to plot and analyse replicator dynamics. It turns mathematical models of adaptation and strategic interaction into phase portraits that can be explored, interpreted, and exported for publication.
View source code Launch Binder tutorial Open in Google Colab
The problem
Evolutionary games describe how the prevalence of competing strategies changes over time under the pressure of natural selection. Evolutionary games offer a variety of dynamical patterns including nonlinear dynamics, boundary equilibria, cycles, and stability patterns that are difficult to understand from equations alone. Researchers and students need a reliable way to connect the underlying model to a clear visual account of its behaviour.
The approach
pyNamo provides a high-level interface for defining a game, integrating its replicator dynamics, finding equilibria, and producing an interpretable phase portrait. The package supports various kinds of symmetric and asymmetric games whose phase portraits can be represented in one, two, or three dimensions.
The analysis includes linear stability classification, Nash equilibria, strict Nash equilibria, and evolutionarily stable strategies where applicable. Its visualisations combine trajectories with optional speed fields, vector fields, and equilibrium markers.
Examples
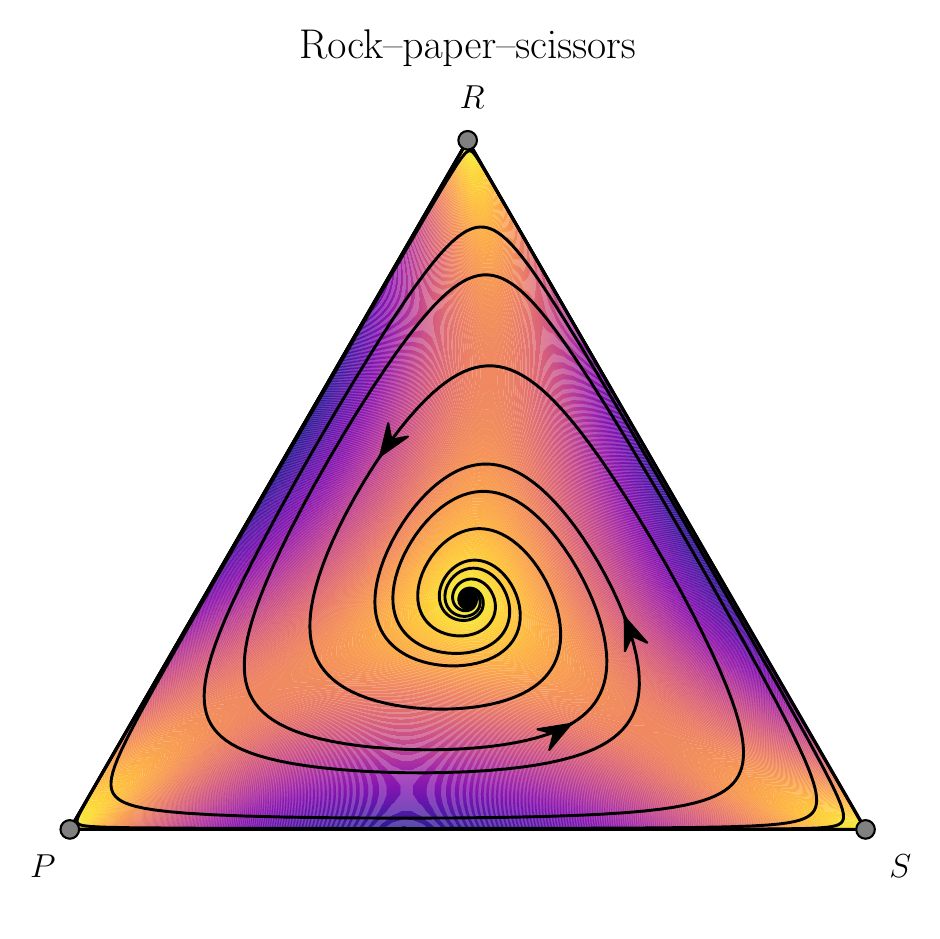
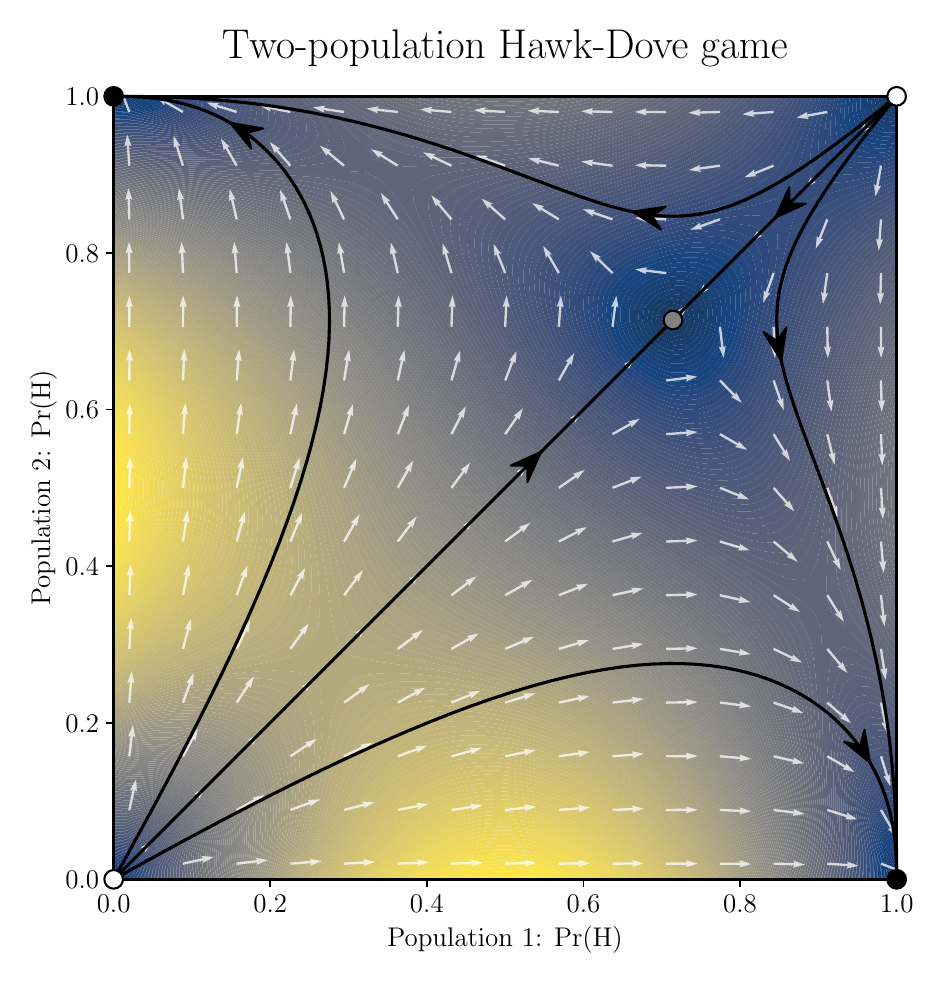
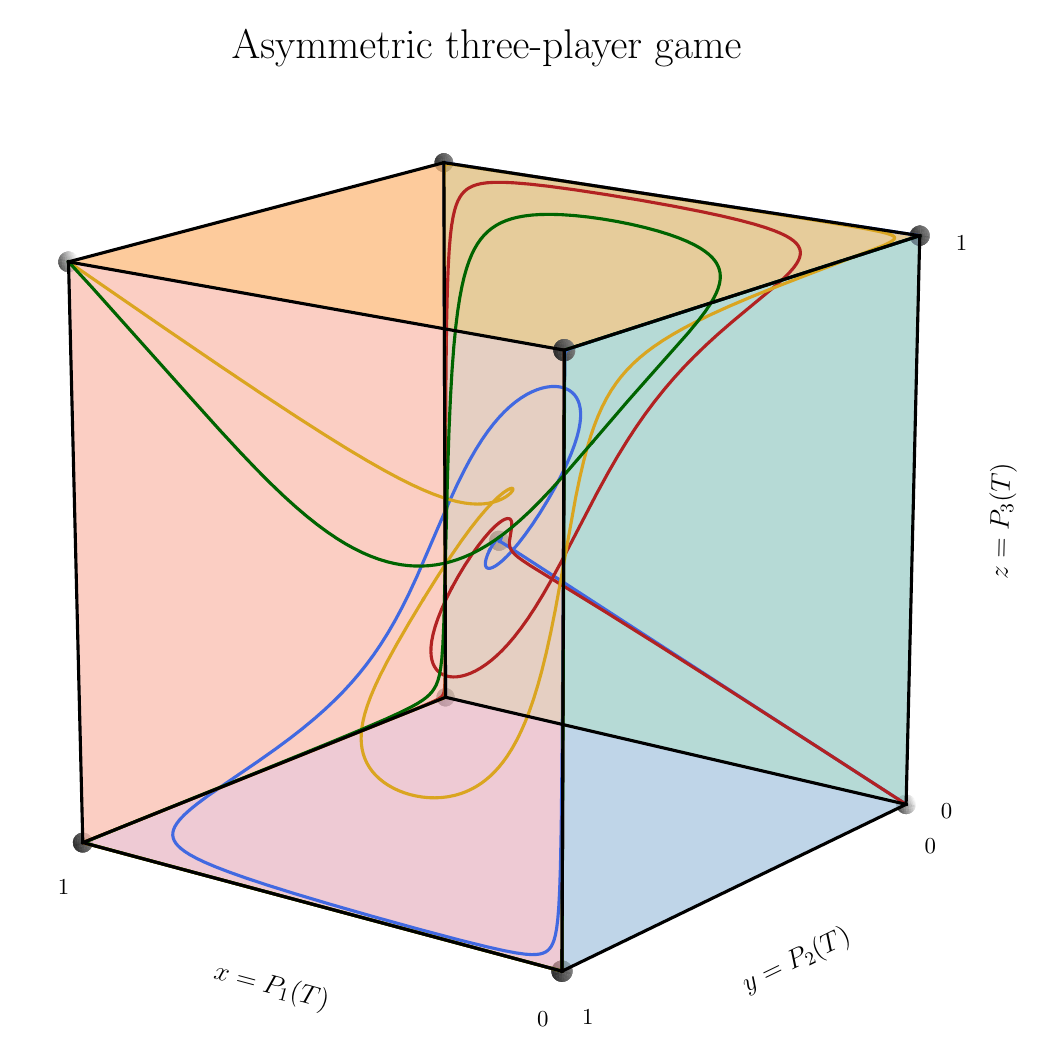
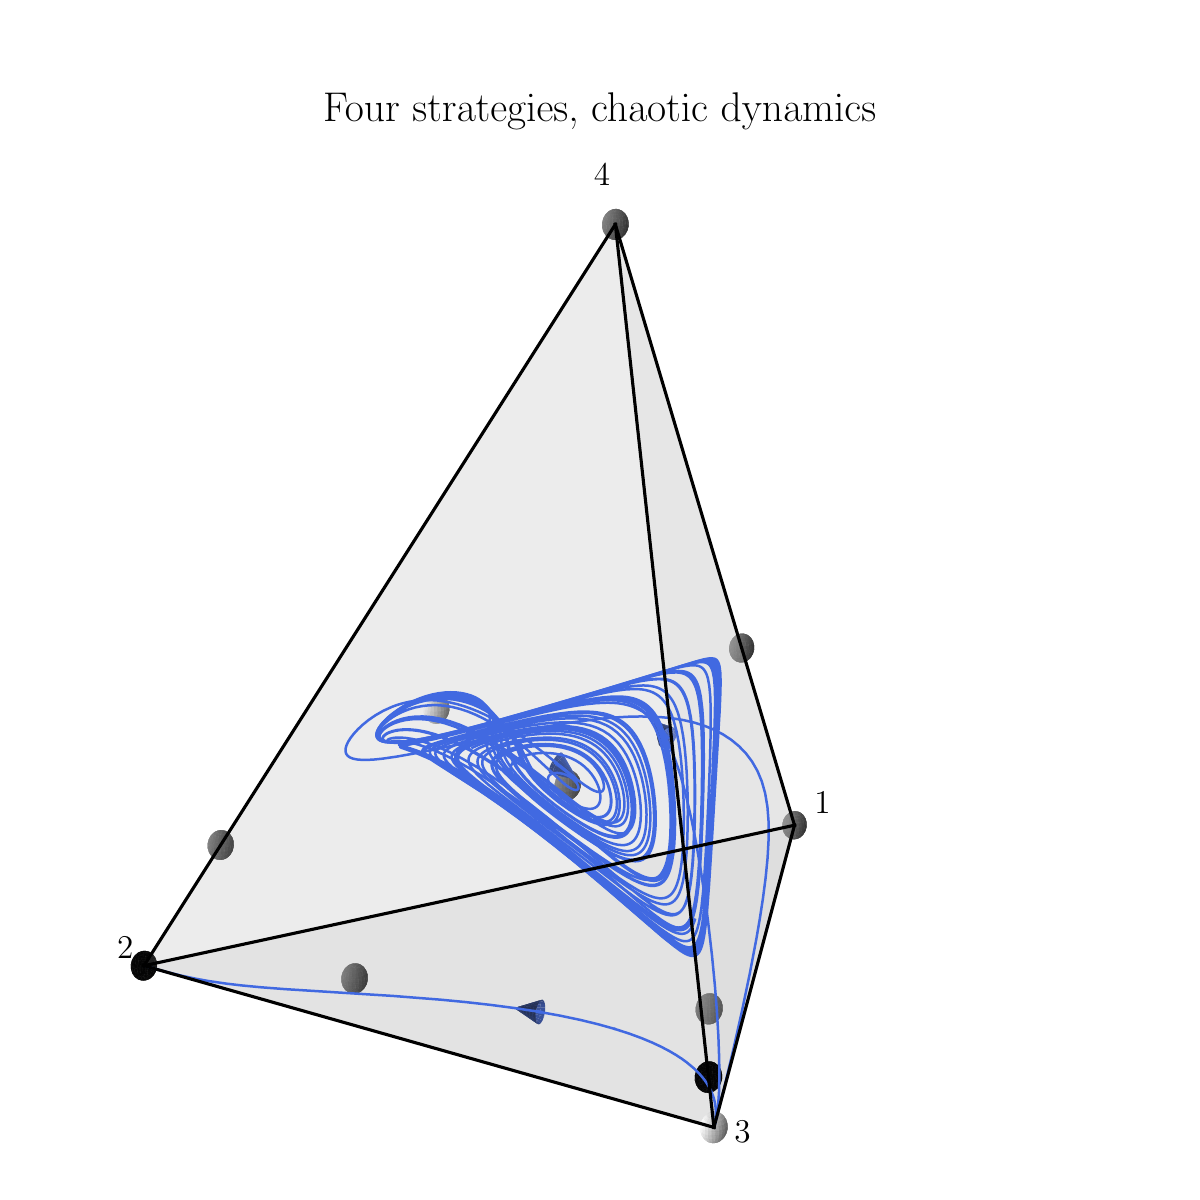
What I built
- A reusable Python representation of several classes of evolutionary games
- Numerical replicator dynamics and rest-point computation
- Equilibrium and stability analysis that respects admissible directions at state-space boundaries
- Two- and three-dimensional Matplotlib visualisations with publication-quality export
- A catalogue of documented example games
- An interactive Jupyter interface for changing examples and display parameters
- Automated tests and browser-based tutorials through Binder and Google Colab
The implementation uses NumPy, SciPy, SymPy, pandas, and Matplotlib. It returns ordinary Matplotlib objects, allowing users to customise or export figures for publication and teaching.